

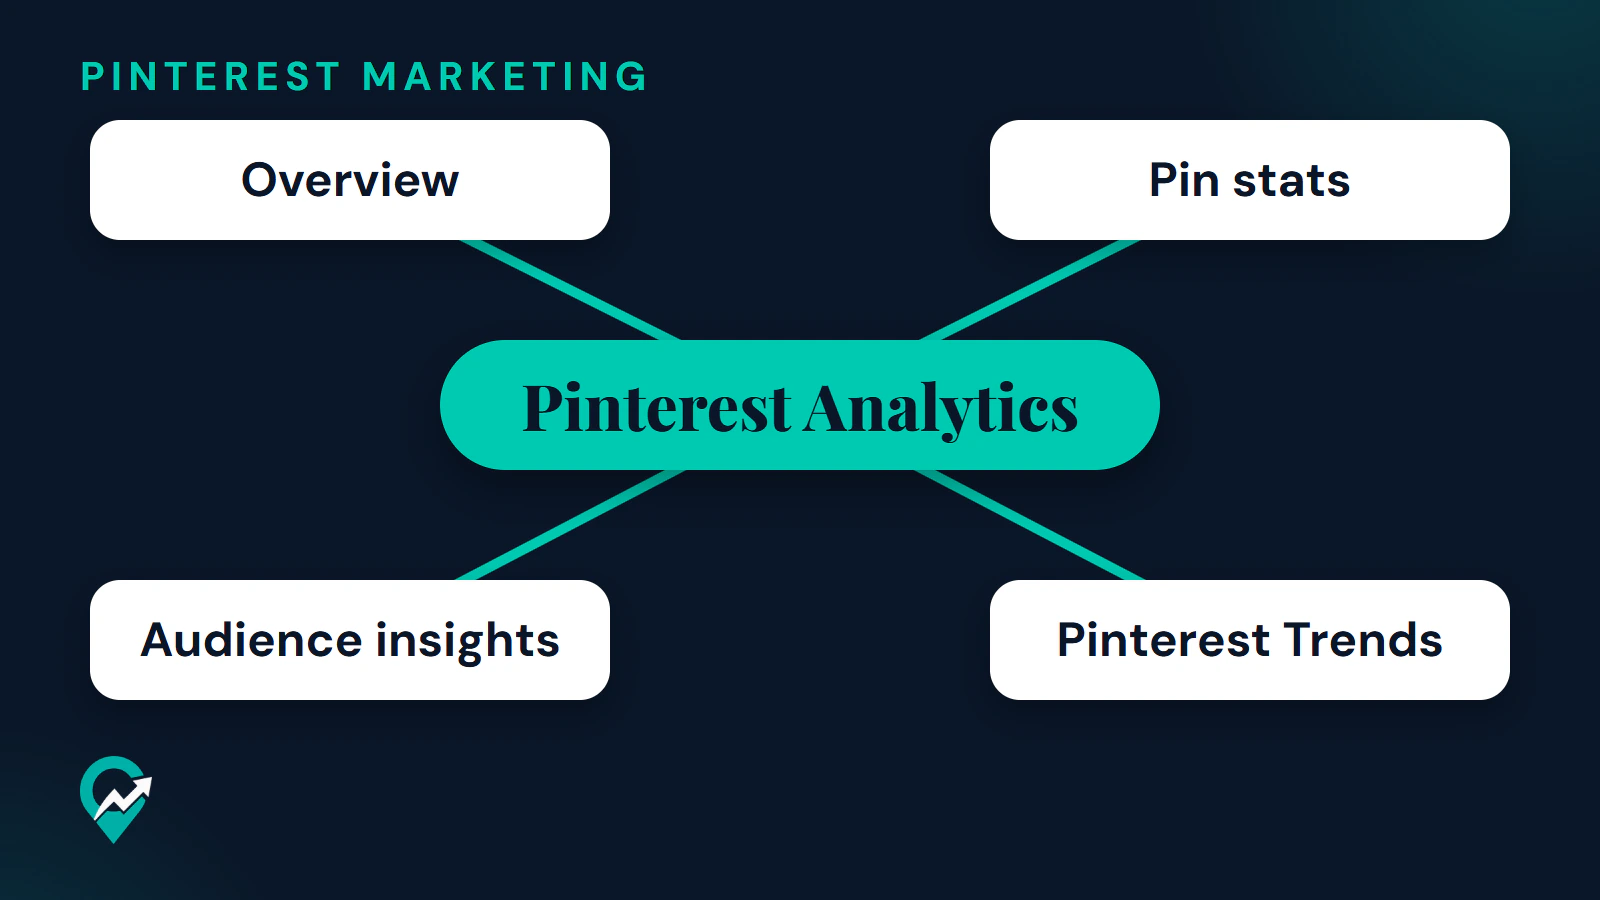

Pinterest Analytics is where Pinterest reports what happens to your Pins, and it is the first place to check whether Pinterest sends readers to your blog. This guide covers where to open it, what each report answers, which numbers to read first when the goal is traffic, a monthly routine and a way to check the result in Google Analytics. It is one chapter of our step by step Pinterest traffic plan for bloggers (opens in a new tab), which covers the account, boards and Pins that produce the numbers.
Where to find Pinterest Analytics
Pinterest says you need a business account to view Pinterest Analytics, and its help page adds that analytics may only be available to account owners above a certain age. If you still use a personal account, our guide to switching to a business account (opens in a new tab) shows the steps and what a business account costs (opens in a new tab) answers the price question.
Claim your website before you read any numbers. Pinterest says that without claiming and verifying your site, everything you save counts as saved content and is not highlighted in the Analytics Overview page. Claiming gives you analytics for the Pins you publish from your site and for the Pins other people create from it. The steps are in our guide to claiming and verifying your site (opens in a new tab).
Open the Overview page on desktop
- Log in to your Pinterest business account.
- Click the hamburger icon at the top-left of the page.
- Under Analyze performance, select Analytics overview.
Pinterest’s pages word this path in three ways. The Analytics help page says Under Analytics, select Overview. A Pinterest Create article from 2026 says Analytics overview under Analyse performance, and the Pinterest Trends help page says Analyze performance. All of them lead to the same Overview page, so look for any of these labels if your menu differs.
Open it in the app
Pinterest’s help page gives these steps for the app:
- Open the Pinterest app and log in to your business account.
- Tap your profile picture at the bottom-right to go to your profile.
- Tap the chart bar icon at the top-left corner.
- Select Analytics.
Pinterest Create adds that on mobile you can also tap the Creator Hub button on your profile page and then Analytics. Some filters are desktop only: the help page says to view Pinterest Analytics on a desktop or mobile browser to filter by age or gender.
The main reports and what each one answers
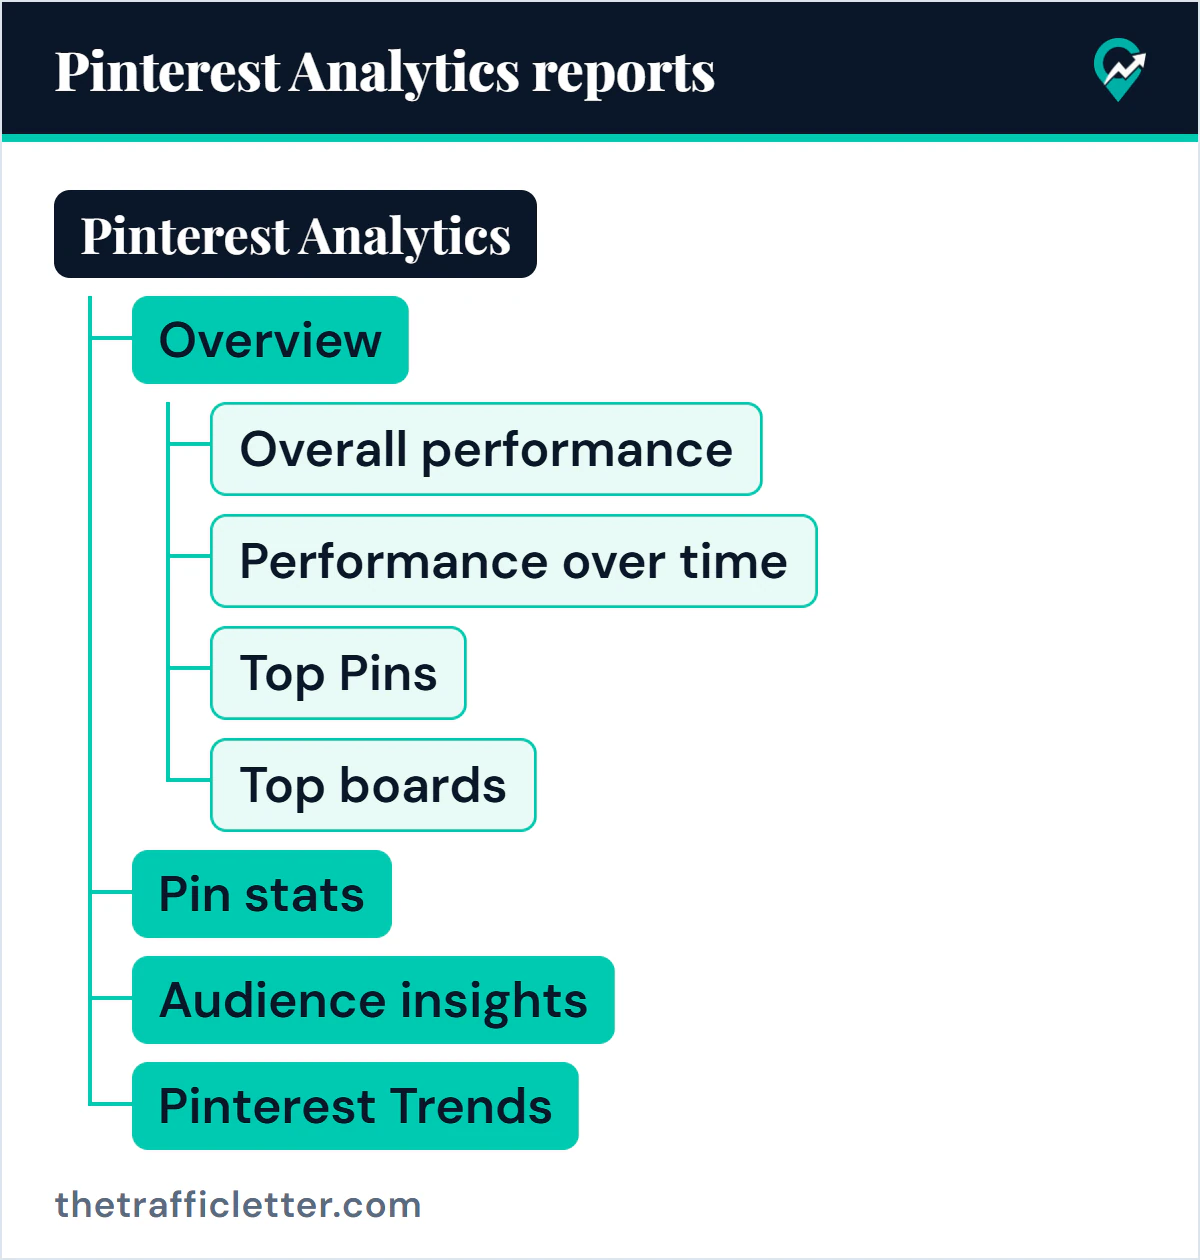
Pinterest Analytics is a set of reports rather than one page. Each answers a different question, and the table shows where to open it and what it tells you.
| Report | Where to open it | The question it answers |
|---|---|---|
| Overview | Analyze performance, then Analytics overview | How are all my Pins and boards doing over the last 30 days? |
| Pin stats | Your profile, Created, a Pin, then See more stats | How did this one Pin perform? |
| Audience insights | Analyze performance, then Audience insights | Which groups of people see and engage with my Pins? |
| Pinterest Trends | Analyze performance, then Pinterest Trends | What are people searching and saving, and when does interest rise? |
Overview
The Overview page shows Overall performance, Performance over time, Top boards and Top Pins from the last 30 days. Pinterest says these real-time metrics are estimates and subject to change, so they might decrease. It adds that real-time analytics are not available for audience metrics or when you use the Content type filter.
Click More filters to narrow the data. Pinterest lists these filters: Date range, Content type, Pin format, Ad format, Product group, Claimed accounts, Device, Age, Gender, Source and Saved content. Date range reaches back a year and a half and can include real-time estimates from the last 48 hours. After you apply a filter, click Export at the top-right corner to export a snapshot of the selected data as a CSV file.
By default the Overview page shows published Pins data only. Pinterest says to tick Include saved Pins if you also want stats for Pins you saved that do not link to one of your claimed domains.
Pin stats
Pin stats shows how people interacted with one Pin. To open it, click your profile picture at the top-right of your screen, click Created below your profile name, select a Pin and click See more stats. Every Pin shows the core metrics Impressions, Saves, Pin clicks and Outbound clicks, and video Pins add video metrics. Our guide to what an impression counts (opens in a new tab) explains the first of them.
Pinterest calculates Pin stats by aggregating the data of all Pins that share an image and, where applicable, a URL. It includes saves made from your profile and from other people’s profiles. Pinterest also says most Pin stats update in real time, so they might look different from the same Pin in Pinterest Analytics.
Audience insights
Pinterest says Audience insights shows what your existing and potential audience is interested in, based on actions such as searches and saves. You can look at your engaged audience, your total audience, Pinterest’s total audience or Pinterest’s engaged audience, each over the last 30 days. Pinterest’s help page calls the interest tables Affinities, and the page itself shows them as Categories and interests, next to Age, Gender, Location and Device. Comparing two audiences and exporting a CSV are desktop features. Our guide on who views your Pinterest (opens in a new tab) explains what these groups can and cannot tell you.
Pinterest Trends
Pinterest describes Pinterest Trends as a historic view, up to the last two years, of top search, save and shopping trends across regions and countries. Some of its features are in testing and only available in certain regions. You can compare up to four keywords on one graph. It helps you decide what to publish next rather than what already happened, which is why it sits next to the keyword work in our guide to choosing Pinterest keywords (opens in a new tab).
Pinterest also offers Conversion insights, a reporting page that measures the effect of organic and paid content together. Its help page says it is available to advertisers with healthy Pinterest tags and shows a Beta label, so it is outside this guide.
Which metrics matter for a blog that wants traffic
Pinterest’s business page says the most important metrics depend on your goals and that there is no catch-all answer. Pinterest Create makes this concrete with a short list per goal. For driving traffic it names outbound clicks, saves, total audience and engaged audience. Pinterest publishes no level that counts as good for any of them, so this guide gives none and compares you only with yourself.
Outbound clicks come first
Pinterest’s Analytics page defines outbound clicks as the number of times people perform actions that lead them to a destination off Pinterest. The Pin stats page words it as the total number of clicks to the destination URL associated with your Pin or ad. Pinterest adds that outbound clicks are measured starting from the date the link is added.
For a blog this is the number closest to the goal, because it is the only one that counts people leaving Pinterest toward your link. It only works if each Pin links to the right post, which is why the traffic guide spends a step on linking each Pin to its post (opens in a new tab). A click is still not a visit, and the Google Analytics section below shows how to check the visit.
Impressions
Pinterest defines impressions as the number of times your Pins or ads were on screen. The rates in Pinterest Analytics use it as their divisor: the engagement rate is total engagements divided by the total number of times your Pins were seen. Our guide to what impressions are on Pinterest (opens in a new tab) explains why they move and what to do with that.
Saves and Pin clicks
Saves are the number of times people saved your Pin to a board. Pin clicks are worded two ways: the Analytics page calls them the total number of clicks on your Pin or ad so it opens in closeup, and the Pin stats page says clicks that lead to a destination on or off Pinterest. Because the wording differs, use outbound clicks whenever the question is about visits to your blog.
Pinterest says the more your ideas are saved, the more your content shows up across Pinterest, and that adding a description, a title or a link and saving to a relevant board helps more people discover a Pin. The format for the text is in our guide to writing Pin text that matches search (opens in a new tab).
Engagements, total audience and engaged audience
Engagements are the total number of engagements on your Pins and include saves, Pin clicks, outbound clicks, carousel card swipes and secondary creative (collections) clicks. Total audience is the number of people who have seen or engaged with your Pins, and engaged audience is the number of people who engaged. Impressions count how many times, while audience counts people. Pinterest says audience metrics are not available in real time.
Monthly views
Pinterest Create says a business account can show stats such as monthly views and followers on your profile, and describes monthly views as a quick way to gauge reach. It points to impressions over time as the guiding metric for deeper insight. Monthly views is not a visit count either, and the page on what monthly views mean on Pinterest (opens in a new tab) covers what Pinterest does and does not say about it.
A monthly review routine for Pinterest Analytics
One review a month is enough for most blogs. Use the same filters every time so the months can be compared.
- Open the Overview page and set Date range to a full month, using custom start and end dates, or keep the default last 30 days if you always check on the same day of the month.
- Set Content type to Organic if you do not run ads. Pinterest says Organic means Pins created or saved by you on your profile, plus Pins created or saved by others that drive people to your claimed website or account.
- Write down the six Overall performance numbers: Impressions, Engagements, Outbound clicks, Saves, Total audience and Engaged audience.
- Under Top Pins, change the sort from impressions to outbound clicks with the chevron. Pinterest says the options are engagements, Pin clicks, outbound clicks or saves. Note the top five Pins and the top boards.
- Open Pin stats for the Pin at the top. Click a metric above the graph to see it over time, or use Split by to split the graph by Content type, Device or Source.
- Click Export and save the CSV in a folder named by month. One file per month builds your own history, because the Date range filter reaches back only a year and a half.
- Compare with the previous month. Ask whether outbound clicks moved in the same direction as impressions.
- Open Google Analytics for the same dates, as described in the next section.
- Decide one change for next month and write it in your note, so the next review can judge it.
Prompt: find which Pins drive outbound clicks
This prompt works in ChatGPT, Claude, Gemini or any AI assistant. Replace the text in square brackets, and paste the exported file or the Top Pins list. Check what is in the file before you paste it and remove anything you would not share.
I run a blog and use Pinterest to send readers to it. Below is data exported from Pinterest Analytics with the Content type filter set to Organic for [start date] to [end date].

Use only the columns and rows that are in the data. Do not invent numbers, benchmarks or a "good" rate. If the data has no row for each Pin, tell me what is missing instead of guessing.

Tasks:
1. List the Pins with the most outbound clicks, with their impressions and saves if the data has them.
2. List Pins with many impressions and few or no outbound clicks.
3. Describe what the top Pins have in common in topic or title, using only the data.
4. Suggest three things to test next month and label each one as a hypothesis.

Output: two tables, one for task 1 and one for task 2, then short bullet lists for tasks 3 and 4.

[paste the data here]
Prompt: write the monthly review note
Write a one-page monthly review note for my Pinterest account, in plain sentences with no hype.

My numbers for [month] from Pinterest Analytics (Content type: Organic): impressions [number], outbound clicks [number], saves [number]. The same month a year earlier or the previous month: impressions [number], outbound clicks [number], saves [number]. Visits from Pinterest in Google Analytics for the same dates: [number] sessions.

My top two Pins by outbound clicks were [Pin 1 title] and [Pin 2 title]. The one thing I changed last month was [change].

Structure: What happened (3 sentences, numbers only from above), What I think caused it (labelled as a guess, not a fact), One change for next month, and When I will check it.

Do not add numbers or benchmarks that I did not give you.
Read the result against your own figures. An assistant can restate numbers wrongly, so the note is only useful if every number in it matches your sheet.
Cross-check outbound clicks with Google Analytics sessions
Pinterest counts clicks that leave Pinterest. Google Analytics counts sessions on your site. Google says a session is a period of time during which a user interacts with your website or app, and that by default it times out after 30 minutes of inactivity. Because the units differ, the two numbers will not match exactly, and neither company publishes an expected relation between them. The check is to see that clicks turn into visits and which posts receive them.
Let Pinterest tag your links
Pinterest says it automatically applies UTM source Pinterest and UTM medium Organic to all destination URLs in your current and future organic Pins. To check or change this, click the hamburger icon at the top-left of your screen, select Business Manager below Manage business, click Business settings and look under URL parameters for organic content for the Apply URL parameters toggle. Leave it on if you want Google Analytics to separate Pinterest visits from other sources.
Find the visits in Google Analytics
Google’s help page for the Traffic acquisition report gives these steps. Sign in to Google Analytics, select Reports from the left menu, then select Acquisition and Traffic acquisition. The report includes the dimension Session source / medium and the metric Sessions, which is the number of sessions that began on your website. Google says you can search for one traffic source in the search bar above the table, and its example is google / organic. Search for pinterest in the same way, since the value follows the UTM values Pinterest applies. If the report is missing from your menu, Google says it may not be in your default view and that Editors can add it back.
Compare the two numbers
Use the same dates in both tools and compare direction rather than equality. If outbound clicks rise and sessions fall, check the points Pinterest lists for performance that trends down: links that work, a site that loads in under 4 seconds, Pinterest allowed to retrieve data from your site, and Pin text that matches the landing page. If both rise, note which Pins were on top and repeat that angle.
Why two Pinterest screens can show different numbers
Before you assume something is wrong, check these documented reasons.
- Real-time metrics are estimates and subject to change, so they might decrease.
- Real-time analytics are not available for audience metrics, or when you use the Content type, Age or Gender filters or split the data.
- Pin stats update in real time and might look different from Pinterest Analytics.
- The Overview page shows published Pins data by default, and the Include saved Pins option adds Pins you saved that do not link to a claimed domain.
Right after: your next actions
- Open the Overview page, set Organic and the last 30 days, and write down your outbound clicks today. That is your first data point.
- Read what impressions measure on Pinterest (opens in a new tab) so you know why that number moves.
- If outbound clicks are low, work on the cause you can control: your weekly Pin rhythm (opens in a new tab) and the words in your Pin text (opens in a new tab). The wider plan is in our guide to the order of work for Pinterest growth (opens in a new tab).